What are Graphic Organizers?
In the traditional teacher centered classroom, the person whose thinking is most visible is the teacher. While making his/her thinking visible is a very valuable contribution of the teacher in the teaching-learning process, it often often encourages passive learning and prevents student learning from becoming visible.
But as a good educator, you really want to i) know what is in the head of your students, ii) encourage active learning in the class (to alleviate boredom in class), iii) ensure a grasp of the relationship between the parts and the whole, iv) facilitate collaborative learning, v) allow for differences in learning styles, vi) ________.
(O, here is another site on active learning which you might find helpful)
Using graphic organizers would represent ONE way of encouraging active, collaborative learning and making student learning visible. (ok, admittedly, it doesn't have to be a collaborative process, but it readily lends itself to group tasks)
Here are a couple of descriptions/definitions of what graphic organizers are and what they do:
1. WriteDesignOnline give a nice explanation:
Graphic organizers are valuable instructional tools. Unlike many tools that just have one purpose, graphic organizers are flexible and endless in application. One common trait found among graphic organizers is that they show the order and completeness of a student's thought process - strengths and weaknesses of understanding become clearly evident. Many graphic organizers show different aspects of an issue/problem - in close and also the big picture. Since many graphic organizers use short words or phrases, they are ideal for many types of learners, including English Language Learners with intermediate proficiency.
WriteDesignOnline maintain that that there are 5 main types of graphic organizers
• Star/web: Use to show definitions, attributes, examples, and brainstorming
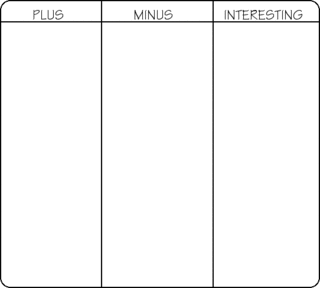
• Chart/Matrix: Use to show attributes, comparing and contrasting, and evaluating.
• Tree/Map: Use to show classifications, pedigrees, analysis, structures, attributes, examples, and brainstorming.
• Chain: Use to show processes, sequences, causes and effects, and chronology.
• Sketch: Use to show physical structures, descriptions of places, spatial relationships, concrete objects, and visual images.
Best of all, they have examples and explanations for all the different types of graphic organizers which can be used to serve a range of learning needs.

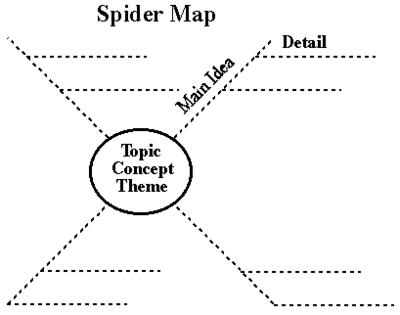
Q: What are Spider Maps useful for?
A: "Analyzing Used to describe a central idea: a thing (a geographic region), process (meiosis), concept (altruism), or proposition with support (experimental drugs should be available to AIDS victims).
Key frame questions: What is the central idea? What are its attributes? What are its functions? "
2. EnchantedLearning.com also provides a nice description of graphic organizers:
Graphic organizers (some of which are also called concept maps, entity relationship charts, and mind maps) are a pictorial way of constructing knowledge and organizing information. They help the student convert and compress a lot of seemingly disjointed information into a structured, simple-to-read, graphic display. The resulting visual display conveys complex information in a simple-to-understand manner.
The process of converting a mass of data/information/ideas into a graphic map gives the student an increased understanding and insight into the topic at hand. To create the map, the student must concentrate on the relationships between the items and examine the meanings attached to each of them. While creating a map, the student must also prioritize the information, determining which parts of the material are the most important and should be focused upon, and where each item should be placed in the map.
The creation of graphic organizers also helps the student generate ideas as they develop and note their thoughts visually. The possibilities associated with a topic become clearer as the student's ideas are classified visually.
Like WriteDesignOnline, Enchanted Learning has wonderful illustrations and explanations of how to use the organizers.

3. The Schools of California Online Resources for Education (SCORE) have nice graphics organizer site in their Teacher Activity Bank. Here you can illustrations/explanations for the following types of graphic organizers: Chain of Events, Clustering, Compare/Contrast, Continuum, Cycle, Family Tree, Fishbone, Interaction Outline, Problem/Solution, Spider Map, Storyboard, Venn Diagram, Graphic Organizers, KWHL Technique, Anticipation/Reaction Guide. They have a parallel webpage for a student equivalent to the teacher's GO.

4. The North Central Regional Educational Laboratory too has nice explanations/illustrations of GOs.
Here is a research article entitle Graphic Organizers are Superior to Outlines in Improving Learning from Texts


0 Comments:
Post a Comment
<< Home